

Today, businesses across the world rely on IT more than ever before. Company operations are being automated, and IT solutions are being implemented across all departments.
While this signifies exciting times for businesses, it comes with its share of challenges as IT systems become sophisticated and extensive. IT support staff are required to be keener on the diagnosis and optimization of these systems to reduce downtime and potential faults that can affect critical business operations. You can visit tvit.net/ to know more about IT services.
One of the best tools for automated network monitoring and management is Nagios. It is an excellent choice for network professionals looking for a tool that is easily customizable and is full of robust features. Nagios is not perfect, and it has its share of downsides, one good side is the use of the network in any of your devices, and if you are trying to look for top technology try the home automation atlanta ga for your home.
It is hard to set up, and configurations can only be done with config files. It has a steep learning curve, and for these reasons, we have listed a few other alternatives to look at.
1. PRTG

PRTG is one of the most all-rounded network monitoring tools in the market. It offers network monitoring, NetFlow analysis, Cloud monitoring, VMware monitoring, and database monitoring in one.
It is easy to set up thanks to the auto-discovery feature that quickly adds any device within your network range to the monitoring environment. Nagios does not have an auto-discovery feature, which makes it harder to set up.
Features of PRTG
- Gives detailed statistics of various network parameters, for instance, CPU load, bandwidth utilization, status and availability to give you a quick overview of network performance
- Packet sniffing feature analyzes all packets going through your network to identify potential issues that increase your bandwidth utilization
- Monitoring is done by sensors configured in a tree-like hierarchy for easy navigation
- Sends a wide variety of alarms and alerts, based on your configuration and threshold values set for each parameter
- Maps out all your devices on the network after discovering them automatically
- Ability to generate comprehensive reports on demand. They can be scheduled and tied to specific sensors, giving you control over what you need and when you want it.
- Various templates for reports allow you to generate reports containing certain information or ones that stretch for over a certain period for historical analysis
- Easily scalable for different network sizes
- Can be accessed on Android and iOS applications
- Allows failover tolerant monitoring which implies that one single failover is included in a single license
- Data can be exported to different file formats, for instance, HTML, CSV, PDF, and XML
Cost
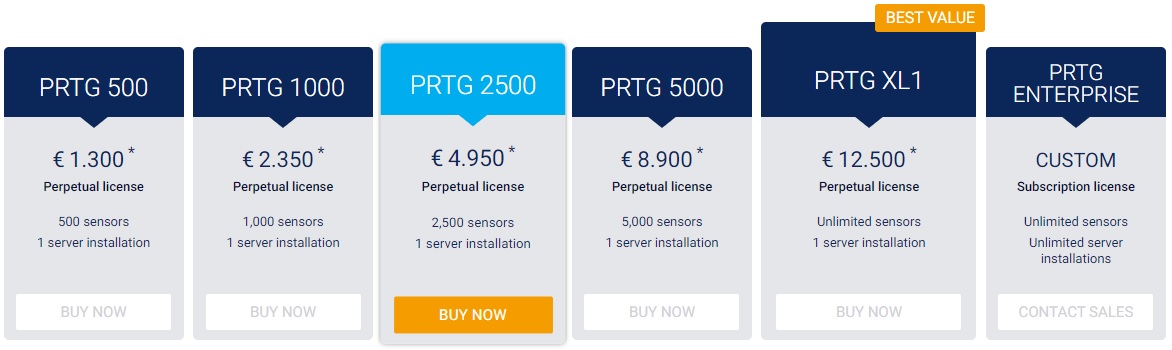
The fee charged depends on the number of sensors used. The breakdown is as follows;
- 100 sensors – free
- 500 sensors – $1,600
- 1000 sensors – $2,580
- 2500 sensors – $5,950
- 5000 sensors – $10,000
PRTG is an impressive contender if you are looking for an alternative to Nagios, but it has a few downsides. It lacks the functionality to import Nagios scripts into programs and does not allow you to create Maps from Libraries.
2. SolarWinds Network Performance Monitor

SolarWinds NPM is a tool that gives a lot of information such as availability, health, performance monitoring, and bandwidth analysis of your network. It is related to other tools that complement its core functions, such as the Network Configuration Manager and NetFlow Traffic Analyzer. It has an easy Nagios Import feature that allows you to migrate all scripts from your Nagios server.
Features of SolarWinds
- Monitors the performance and availability of all devices on your network regardless of whether they are located on-site or in the cloud
- Advanced fault monitoring feature can quickly identify faults, decipher their cause and fix them automatically
- Gives intelligence-based alerts, that are reliant on various parameters such as topology, devices, and performance
- Auto discover feature quickly identifies and maps devices on the network topology
- Fully customizable portal that lets you change thresholds and set fault levels that determine when alerts should be raised
- Monitors performance for client endpoints, autonomous access points, and wireless controllers
- Easy to setup up and deploy
- Allows you to understand whether the network or application causes end-user experience issues
- Contains over 100 report templates
- Monitors key hardware metrics such as fan speed, temperature, and power supply levels
Cost
SolarWinds does not have a rigid pricing system. They offer a perpetual and subscription license depending on your needs. For the perpetual license, you retain the right to use the tool indefinitely, get one-year maintenance, and support with the option to renew after a year. For the subscription plan, you use the software for the entirety of the subscription term and get full maintenance and support during this period.
One of the main downsides of this tool is that it has no built-in real user monitoring. Besides, competitive monitoring can only be configured through Orion, which is a concern.
3. Zabbix

Zabbix is an excellent Nagios alternative if you are in the market for an open-source solution. It is designed to monitor multiple devices across a network, and they have recently improved their user interface, making it a favorable option for those seeking a reliable Nagios alternative.
Features of Zabbix
- Contains multiple metric collection methods that span over to various protocols such as SNMP, IPMI, and IPv6 among others
- Flexible and scalable data collection algorithm that can give aggregated metrics and even preprocess data such as specific reports from a legacy device
- Autodiscover feature allows it to detect network devices and their status
- Starts to monitor all network nodes automatically when added by the Autodiscover feature
- Clones and mass updates all similar network devices using various templates for easier monitoring and reporting
- Flexible problem definition depending on expressions specific to a user and the ability to avoid false positives by hysteresis definition
- Ability to define multi-level dependencies between related network nodes to point out core failure
- Proactive network monitoring to predict potential downtimes quickly, trends in bandwidth usage and any anomalies with network use
- Customizable notifications and alerts that are sent through email, SMS or messenger
- Easy integration with third-party software used to help with business processes such as ticketing, inventory and billing systems
- Unlimited scalability
- You can create new applications to work in Zabbix
Cost
It is an open-source tool and free to use
4. OpenNMS

This is a free open source network monitoring platform that is enterprise-grade and robust enough to meet any company’s needs. It is designed for Linux Operating systems, but it also supports Windows and OSX.
It utilizes service monitors that can be configured by a user to collect information about the availability and latency of business applications.
Features of OpenNMS
- Its algorithm is based on an event-driven tree diagram that allows flexible integration
- Data can be accessed through RESTFUL API
- Ability to receive alerts through various channels such as email, Slack, jabber and MatterMost
- Easy to run third party scripts that customize alerts
- Can be integrated with numerous third-party applications such as existing ticketing tools or business management software
- Database schema is managed by Liquibase, which makes updates and maintenance a nonissue
- Can test generic TCP connections, status, and resources from management agents
- Simplifies the monitoring of services on an IP network using a critical service feature that sets the software to send events and create alarms for those vital services. This way, when a vital function of an IP interface is down, no event or alerts are generated for other services on that IP interface
- The ‘critical paths’ feature establishes connections to the networks that are critical, and once one part is down, users won’t be overwhelmed by many alarms as a result of a fault with one critical component in the entire path. They will only get a notification of the critical component that is down for easier fault recovery
- Flexible dashboard helps to organize all monitoring components in one place and give users an aggregated view of their network
Cost
It comes in two tiers; Meridian and Horizon. Meridian is a subscription box that offers access to an optimized and stable version of OpenNMS. You do not have to spend a lot of time and resources maintaining it, as features that have been tested and proven in the free version are migrated to Meridian.
The cost of subscribing to OpenNMS Meridian starts at $2,000 annually, depending on your requirements. Horizon is a free version that has the newest features released at a very rapid schedule. It contains features that are being tried out and tested by the users and members of the open NMS community.
5. WhatsUp Gold

This is a unified, on-premises network monitoring software by IPSwitch for medium and large companies and service providers. It is designed for Windows users, and it offers robust tools to show connections between network devices, monitor them, and allow administrators to control and view all activities within their IT infrastructure.
Features of WhatsUp Gold
- Network mapping and discovery module uses the power of layers 2 and 3 discovery to allows one to discover all devices on their network
- Has an auto-discover feature that can scan the network based on the IP range of the routing table using an SNMP smart scan
- Automatically determines dependencies between network nodes to identify paths and reduce unnecessary alerts
- Has robust monitoring features that offer passive and active alerts and the ability to handle events based on configured policies
- It utilizes protocols such as SSH, SNMP, and WMI to track multiple metrics such as disk utilization, CPU memory among others
- Offers cloud monitoring dashboard for easier billing and monitoring of cloud resource usage
Cost
WhatsUp Gold is billed on a quote-based plan, and you have to contact the vendor to get a custom quote. It has a free trial that you can use to determine if the features are right for you.
6. Icinga

This is an open-source network monitoring system that was initially designed to complement the Nagios monitoring system. It derives its name from the Zulu word that means “examine or crosscheck.”
It has a user-friendly interface that allows users to utilize an object-based configuration or a monitoring code using REST API for network monitoring and IT applications.
Features of Icinga
- Integrates easily with the majority of DevOps tools allowing it to meet various business requirements
- Supports both SNMP and direct monitoring
- Provides a reliable database, net-flow, and application monitoring
- Allows users to scale up to numerous nodes quickly
- Advanced reporting module with a customizable SLA, top database connectors for PostgreSQL for redundant monitoring
- Simple plug-in design allows you to set up your service checks quickly
- Users have a choice of two platforms; Icinga Classic UI and Icinga Web
- Use of RESTFUL API will enable one to update configs swiftly and show any detail about the network
- Has a distributed setup that makes it ideal for large and complex IT systems
- Icinga’s metadata gives you a more in-depth insight into your network performance
- A reporting system is based on open source Jasper Reports
Cost
It has an enterprise pricing structure that is available on request. It is customized for one’s specific needs.
7. Atera

This is a remote monitoring and management software that serves both the service providers and IT professionals looking for an all-round platform that consolidates all their IT monitoring needs in one. It is fully remote, allowing administrators to manage and maintain customer issues regardless of their location.
Features of Atera
- Uses a technician-based pricing model that makes it cheaper and transparent than most other tools
- It combines Remote monitoring management, professional services automation and remote access in one
- Can monitor and manage an unlimited number of stations and servers on your network
- It is cloud-deployed, a reason why it is a full SaaS system
- It can be accessed from any device
- It has an easy to use interface that makes it simple to bring non-technical staff up to speed with the operations
- Configured with TLS and 256-bit AES encryption to make all sessions secure
- Uses a wide array of analytic metrics to measure loads and network performance among others
Cost
The price breakdown is as follows;
- • Pro – $79 per technician per month
- • Growth – $119 per technician per month
- • Power – $69 per technician per month
FAQs
Nagios and Zabbix are both excellent network monitoring tools. However, Zabbix has the edge over Nagios since it is free, but its features still rank it high up amongst the paid network management tools. It offers a great user experience and more flexibility that allows one to configure it to their specific requirements efficiently.
Nagios Core is a free version of the network management software. It offers hundreds of add-ons and the ability to monitor any network device using IP addresses.
The term Nagios refers to Nagios Core, which is a technical management version of the tool that requires extensive resources to set up, configure, and manage network nodes. Nagios XI is the simplified version of the tool that is designed for non-technical users. It has a more user-friendly platform that users can view various network parameters and get any information they need on the fly.
In terms of how they support business needs, Nagios is used for technical output, for instance, when trying to investigate why a network device is down. Nagios XI is used for enterprise clients who need to report data, justify costs, and present information regularly.
Bottomline
The top Nagios alternatives have been listed and it is evident that you are not short of options when seeking a robust network monitoring tool.
Note that there is no “perfect” tool and it all depends on how the features suit your business requirements. With the list above, you should find one that fits the billing for your desired application for enhanced network monitoring and management.

- CISSP vs CISM: Which Certification is Right for You? - December 11, 2021
- Should I Learn C++ or Java - December 8, 2021
- C# vs C++: What’s the Difference? - November 28, 2021


No Comments